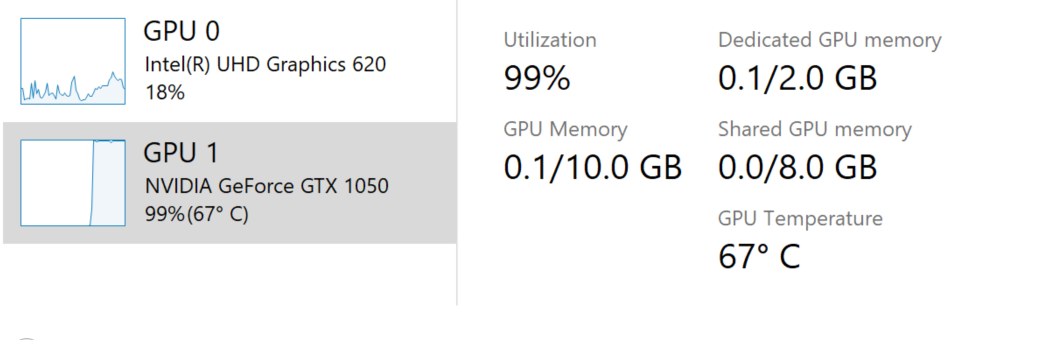
Open Task Manager with Ctrl+Shift+Esc, select the Performance tab and read the temperature shown next to your dedicated GPU, in Celsius.
On this page
The NVIDIA app and AMD Software: Adrenalin Edition add in-game statistics, stress tests and fan controls, and the sections below cover safe limits, cooling and readings that will not appear.
Monitor GPU temperature in Windows Task Manager
Task Manager has shown the current temperature of a dedicated graphics card since Windows 10 Insider build 18963 (20H1). It needs no download, and the reading comes from the card's own graphics driver.
- Press Ctrl+Shift+Esc to open Task Manager.
- Select the Performance tab.
- Find the GPU entry for your graphics card in the list on the left; the temperature sits next to it in Celsius.
- Select that GPU entry to open its full graphs, then leave the window open while you play or render to watch the temperature change under load.
Task Manager shows the temperature only for a dedicated GPU card, and the card's driver must support WDDM 2.4 or higher. The troubleshooting section below covers both checks.
Which GPU temperature monitoring tool should you use?
| Your situation | Use this | Why |
|---|---|---|
| You want one quick reading on the desktop | Task Manager, Performance tab | Built into Windows, no install, any dedicated card with a WDDM 2.4 driver |
| You want statistics on screen while a game runs, NVIDIA card | NVIDIA app overlay (Alt+Z, then Alt+R) | The manufacturer's statistics overlay sits on top of the game, and you choose which metrics it shows |
| You want a temperature or fan speed limit, GeForce RTX card | NVIDIA app, System > Performance | Temperature and fan speed targets steer NVIDIA's automatic GPU tuning |
| You want the hotspot sensor, AMD card | AMD Software: Adrenalin Edition, Performance Tuning | Shows GPU Hotspot Temperature on Radeon VII, Radeon RX 5000 Series and newer |
| You want to test cooling under a sustained load, AMD card | AMD Software Stress Test | Runs a timed load and displays readouts in real time |
| Your GPU is integrated into the processor | Not Task Manager | Windows shows a GPU temperature only for a dedicated GPU card |
| You need a feature none of the above has | Third-party GPU temperature monitoring tools | Download them only from the developer's own website, never from a bundle that adds driver updaters or PC cleaners |
How to check GPU usage from Task Manager
The same Task Manager screen that shows temperature also shows how hard the GPU is working, which tells you whether a high reading comes from real load.
- Open Task Manager with Ctrl+Shift+Esc and select the Performance tab.
- Select your GPU to see utilization for each GPU component, such as 3D and Video encode/decode, plus graphics memory usage.
- Select the Details tab to see GPU utilization for each running process.
- Compare the two: if the temperature is high while utilization is low, look at the cooling before anything else.
Monitor an NVIDIA GPU with GeForce Experience or the NVIDIA app
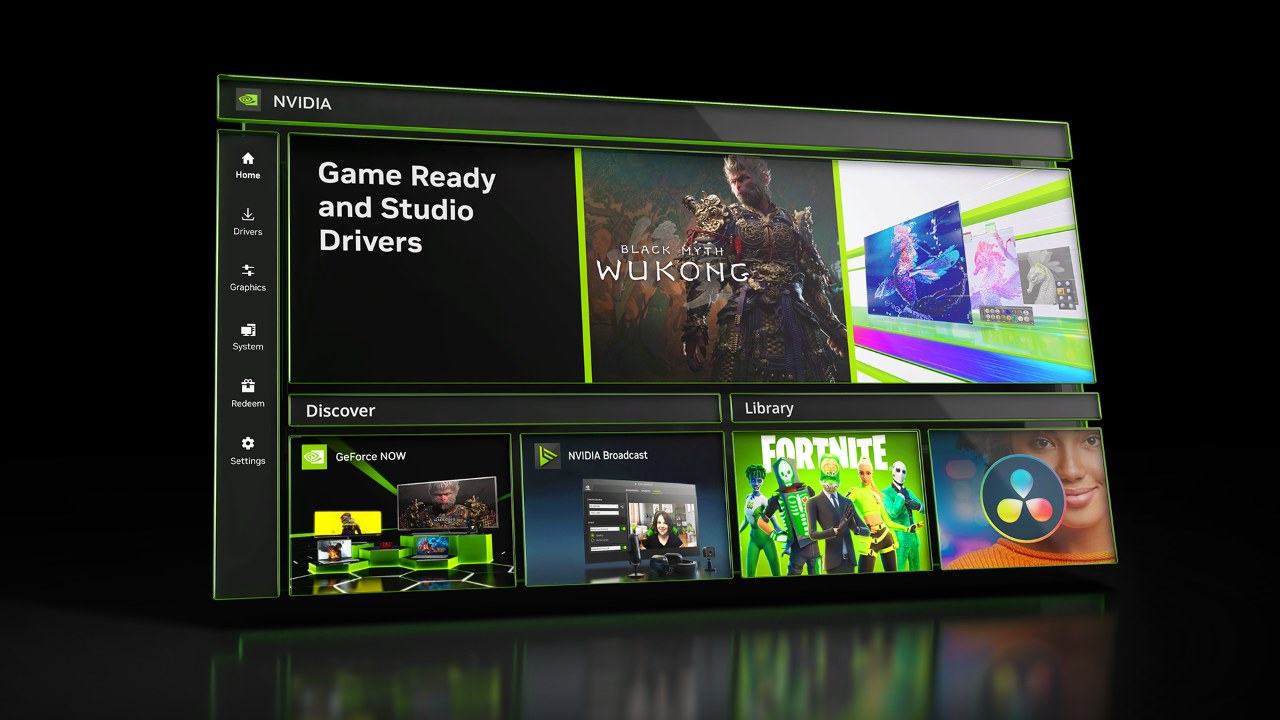
The NVIDIA app incorporates many of the top features from GeForce Experience and unifies them with the NVIDIA Control Panel's 3D settings. Its redesigned in-game overlay keeps the Alt+Z hotkey from GeForce Experience and adds a statistics overlay with metrics you pick.
- Open the NVIDIA app, select System in the left navigation and open the Performance tab to monitor your GPU; on GeForce RTX desktop cards and laptops this panel also holds automatic GPU tuning.
- Start a game, then press Alt+Z to open the in-game overlay.
- Select Statistics > Statistics View and choose which performance metrics the overlay shows.
- Press Alt+R to show or hide the statistics overlay during play.
Check GPU temperature with AMD Radeon Software
AMD Radeon Software is now called AMD Software: Adrenalin Edition. Its temperature readouts live in Performance Tuning, which needs the full installation of the software.
- Select Start, type AMD Software and open the app under best match.
- Type "Tuning" into the search box and select the Performance Tuning result.
- If more than one GPU is installed, select the one you want to monitor.
- On Radeon VII, Radeon RX 5000 Series and newer cards, read GPU Hotspot Temperature here.
- To watch temperatures under a steady load, open Stress Test, set the Duration slider (the default is 60 seconds) and select Start Testing.
- Watch the real-time readouts, then select Stop Testing or wait for Finish.
Intake Temperature in the stress test readouts is the air entering the GPU cooler, not the chip itself, and only reference Radeon RX 7900 Series cards report it.
How hot is too hot for a GPU?
Too hot is the maximum temperature the GPU maker specifies for your card. NVIDIA lists it on each GeForce card's specifications page as Maximum GPU Temperature (in C).
| GPU | Maximum GPU temperature | Where it is stated |
|---|---|---|
| GeForce RTX 5090 | 90°C | NVIDIA RTX 5090 specifications |
| GeForce RTX 4090 | 90°C | NVIDIA RTX 4090 specifications |
| GeForce RTX 4060 family | 90°C | NVIDIA RTX 4060 family specifications |
| AMD Radeon | Not given on AMD's tuning page; Radeon VII, RX 5000 Series and newer report a separate hotspot reading | AMD Performance Tuning article |
NVIDIA's figures apply to its Founders Edition or reference design, and specifications may vary by add-in-card manufacturer. Check the specification page of the exact model you own.
How GPU temperatures affect speed and throttling
Keep the GPU well below its maximum temperature if you want it to hold its highest clock speeds. NVIDIA GPU Boost raises GPU core and memory clock rates only when sufficient power and thermal headroom are available. A card running close to its temperature limit has little thermal headroom left, so it has less room to boost than the same card kept cool.
How can you cool your GPU down?
Start with airflow, then use the GPU maker's own controls: the Performance tab in the NVIDIA app, or Performance Tuning in AMD Software.
- Clear dust from the graphics card's fans and the case intakes, and keep the intakes unobstructed.
- On a GeForce RTX card, open the NVIDIA app, select System > Performance and set a temperature target, so automatic tuning maximizes performance without going above that threshold.
- On an AMD card, open Performance Tuning and, on supported cards, select Undervolt GPU, which reduces voltage while maintaining clock speeds to improve performance per watt.
- For manual AMD fan control, select Custom, turn on Fan Tuning and raise Max Fan Speed (%).
- Turn on Advanced Control to set a fan curve on the Fan Speed (PWM (%)) / Temperature (Celsius) chart.
- Select Apply Changes, then run Stress Test to confirm the new settings are stable.
Zero RPM is on by default on AMD cards and lets the fans stay still under light load; they should spin up as GPU load and temperature increase.
How to check your GPU temperature reading responds to load
- Note the temperature in Task Manager's Performance tab with the PC idle on the desktop.
- Start a demanding game or the AMD Stress Test and watch the temperature climb as GPU utilization rises.
- Stop the load and confirm the temperature falls back toward your idle figure.
- If the figure never moves, or no figure appears, work through the troubleshooting steps below.
Fix GPU temperature not showing in Task Manager or overlays
Task Manager shows no GPU temperature
The temperature only appears for a dedicated GPU card with a driver that supports WDDM 2.4 or higher.
- Press Win+R, type dxdiag and press Enter.
- Open the Display tab and read the WDDM version next to Driver Model.
- If it is below 2.4, install the latest driver from NVIDIA, AMD or Intel.
- If the only GPU listed is integrated graphics, Task Manager will not show a temperature for it.
The NVIDIA overlay statistics show N/A
A known NVIDIA app issue left statistics reading N/A after a client update, and NVIDIA has since fixed it.
- Update the NVIDIA app to the latest version.
- Press Alt+Z, reopen Statistics and select the metrics again.
AMD Software shows no hotspot temperature
GPU Hotspot Temperature is only available on Radeon VII, Radeon RX 5000 Series and newer cards.
- Check your card model in AMD Software.
- On older Radeon cards, use Task Manager's temperature reading instead.
- Confirm AMD Software is the full installation, since Performance Tuning needs it.
The PC crashed or restarted during the AMD stress test
The current tuning settings are unstable, and AMD Software resets them to default values after a failed test.
- Open Performance Tuning and check that the settings are back at default.
- Reapply a milder change, such as a smaller fan or power adjustment.
- Run Stress Test again before gaming on the new settings.
GPU temperature FAQ
What's a normal GPU temperature range while gaming?
Any gaming reading that stays under the maximum temperature your GPU maker specifies is within the design range. NVIDIA lists 90°C for the GeForce RTX 5090, RTX 4090 and RTX 4060 family. Compare your figure with the specification page of your exact model.
What about idle GPU temperatures?
Use your own baseline: note the Task Manager reading on a quiet desktop and compare against it later. On AMD cards with Zero RPM enabled, the fans can stay still under light load and should spin up as load and temperature increase.
Do GPU temperatures affect longevity?
Running within the maker's specification is what the card is designed for. AMD warns that operating outside official specifications or factory settings may damage components and shorten system component life, and such damage is not covered by AMD's product warranty.
Can Task Manager show GPU temperature in Fahrenheit?
No. Task Manager reports the GPU temperature in Celsius only. Convert the figure yourself if you need Fahrenheit: multiply by nine, divide by five and add thirty-two.
Do I need GeForce Experience to see an NVIDIA GPU temperature?
No. Task Manager shows the temperature of any dedicated NVIDIA card with a WDDM 2.4 driver. The NVIDIA app, which carries over many of the top GeForce Experience features, adds an in-game statistics overlay opened with Alt+Z and toggled with Alt+R.
Does NVIDIA automatic GPU tuning void the warranty?
No. NVIDIA states that Automatic Tuning will not damage your GPU or invalidate its warranty. The scan takes 10 to 20 minutes, and NVIDIA recommends leaving the system idle while it runs, because activity can affect the results.